The Three Most Important Features of Google Analytics

5 Website Design Trends That Never Go Out of Style
January 17, 2017
Are You Making Decisions or Knee Jerk Reactions?
April 25, 2017
Google Analytics (GA) is a powerful analytics tool. I know that statement is not very original but how many business owners really understand how to use it? There are tons of features and data that GA provides but I really want to focus on a few features to get a business owner started understanding Google Analytics.
Learn the tables
The most common view with Google Analytics is the table view which looks something like this:
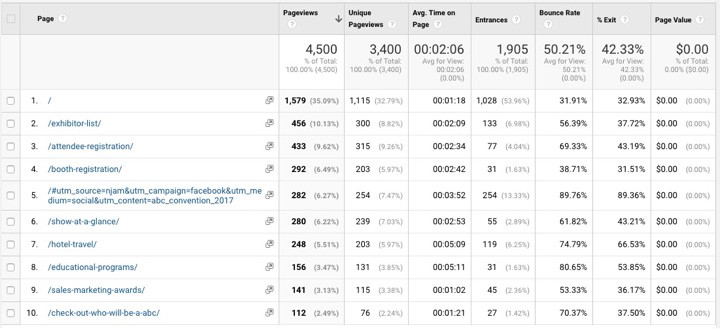
This view is very easy to understand and has a wealth of information once you understand what each column means. For example, pageviews is pretty obvious, the number of times a page was viewed, however, the more important column is the next one which is Unique Pageviews. Unique Pageviews tells you how many different people saw the page within a particular timeframe. Think about it as how far the message on the page has spread.
The other important stat in this view is Bounce Rate. A bounce is when a visitor comes to a page and doesn’t interact with the page in any way. If your homepage has a bounce rate of over 50%, you need to rethink your design because more than half of your visitors have not moved past the homepage.
As you can see with this site row number 1 is the homepage and it has a 32% bounce rate. That means that nearly 70% of the visitors to the homepage have clicked and moved on to another part of the site. In which direction did they go? Which page did they go to next? Although this chart is very helpful, it only tells some of the story which is why I rely more on the User Flow charts that GA provides.
Go with the flow
How a visitor moves through the site is as important and where they go. This is particularly helpful if you have an eCommerce site or site where you want the flow of traffic to go to a particular page. You want to make sure that the flow from homepage to checkout is seamless and that not too many visitors wander off to other parts of the site. A Users Flow chart looks something like this:
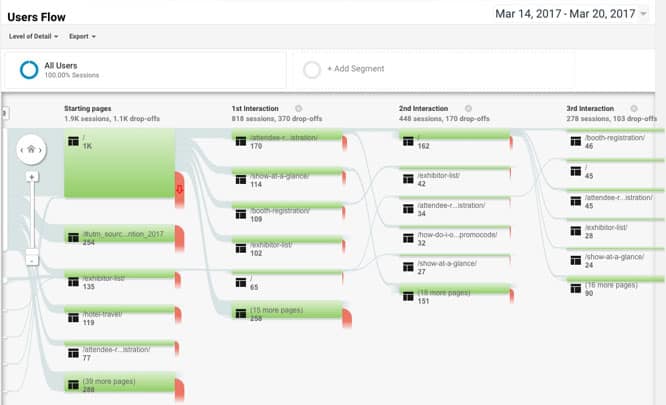
Just to give you some bearings, the green areas represent the pages. The wider the bar, the more traffic that page gets in that interaction. In this example, the big green area at the top left is the homepage. The grey bars represent the flow of traffic. Again, the wider the bar the more traffic flow. The red tails represent drop-offs. The red tails show how many people stopped their visit on that page. Again, the wider the bar, the more traffic flow.
You can see by this example that by the third interaction of the site the traffic has dropped off significantly. If your third interaction is your checkout page, you may want to find out how and why a small percent of your traffic makes it that far. That is one of the reasons this view on GA is so important especially for user experience design. I wrote an article recently that an additional dimension of user interaction with the page such as heat maps and scroll maps can also help increase your conversion rate. In any case, understanding how traffic moves through your site is important because it gives you information about roadblocks that could be costing you money. For example, if you have a page with a bunch of products and you see a significant drop off, you may want to study why.
The last feature I want to talk about is goal setting in GA. Why? If you have a page, we’ll call it the money page, that you want visitors to go to because that page will bring in the money, you can set that as a goal in GA and you can analyze the flow of traffic to that page and figure out what referral sources are working and which are not.
Gooooooal!
Setting up goals in GA is relatively straightforward. You set goals by going into your Admin section then in the third column, under View, you will see Goals. Click on it and then click on the red New Goal button.
You need to give the goal a name. Usually something you can understand particularly if you have several goals set on a site. Speaking of several goals, not all the goals have to be the money page. There can be what are called micro conversions. A micro conversion can be a newsletter sign-up or watching a product video basically, any interaction with the site that you find significant and want to track.
Once you give the goal a name you need to set the Goal slot ID and the Type. The Goal slot ID is usually set by default and for our purposes that will usually work. The Type is the type of interaction you want to track. The most common is a destination page like a checkout completion page but it can also be a series of pages or video view or the duration that a visitor is on a page. Once you select the type, hit continue and fill out the information that GA needs to track the goal. It is usually a page or pages url or a duration. Once you do that you can click on Verify this Goal and GA will check if it is working properly. Click Save and you’re done. Now you will be able to track your goals in terms of percentage of site visits or user flow or referral source or many of the other tracking dimensions that GA offers.
Wrapping up
This is just the basics of Google Analytics. There is so much more you can do but for the mainstream user, this is usually enough to get you going. If you want to make money from your site it is important to understand how the visitor is interacting with your site. It is also important not to make assumptions. Predicting human behavior is tricky and just when you think you got it pegged they switch in another direction.
Use the data that GA provides as a guide to experiment and ask the question, “why?” Never take the stats at face value as there is always a reason things are happening. By asking questions and experimenting, you will be able to get more consistent results and, in the end, make more money online.


