What is Social Proof in Digital Marketing?
July 1, 2019
What Are The Best Ways To Identify Your Target Market?
September 9, 2019If you ask this question, you probably know how important audience demographics are to your digital marketing strategy. Before you start any digital marketing campaign, it is important to know what your current situation is. You need to know who is currently coming to your site and how they flow through your website. This discovery process is important to determine a starting point.
Finding your audience demographics is relatively easy if you have your tracking set up properly. Most social media platforms have their own audience tracking that coincides with their advertising platform. These work pretty well. Google Analytics is probably the most popular for small to medium-sized businesses, so that I will focus mainly on that. Other analytics applications are more sophisticated and more expensive, but Google Analytics will work fine for our purposes.
Setting up Google Analytics Properly
The first thing is to determine that Google Analytics is installed on your site, and the second is being able to access it to read the reports. I am shocked how many business owners have no idea whether or not they have it installed or, if they do, how to access it. I will walk you through the steps to determine if you have Google Analytics installed. If you know you have it installed, you can skip down to “Make Sure That Google Analytics is Tracking Demographics.”
Open your website in a browser (Chrome is my preferred, but they all work basically the same) and right-click somewhere on the page. Look at the right-click menu and look for something called View Page Source or View Code. Click on that, and a new tab will open up. Now you will see a full page of HTML code.
Before your eyes glaze over, we are looking for something very specific. We want to see if the JavaScript for Google Analytics exists within the code of your site. This isn’t as hard as you think. What we are looking for is one of the following two libraries: google-analytics.com or googletagmanager.com. A site can use multiple instances simultaneously, so don’t worry if you find duplicates.
You can scan the code to find it, or you can use the shortcut method. Hit either Command F (Mac) or Control F (Windows), and a search box will appear at the top of the page. Type in each of the libraries, one at a time, until you get a hit. If you find one of them, Google Analytics is installed. If not, we have to install it. If you have Google Analytics installed, now we need to be able to access it. If not, skip to “Installing Google Analytics” on how to install it.
For everyone who is left, you need to be able to log in. Believe it or not, this is usually the sticking point. Point your browser to https://accounts.google.com and log in with your Google login. If you determined you have Google Analytics but have no idea what your Google login is or that if you even have one, there’s a good chance you don’t have access to Google Analytics. Unless you find it, you will have to start over. If that’s the case, skip to “Installing Google Analytics.”
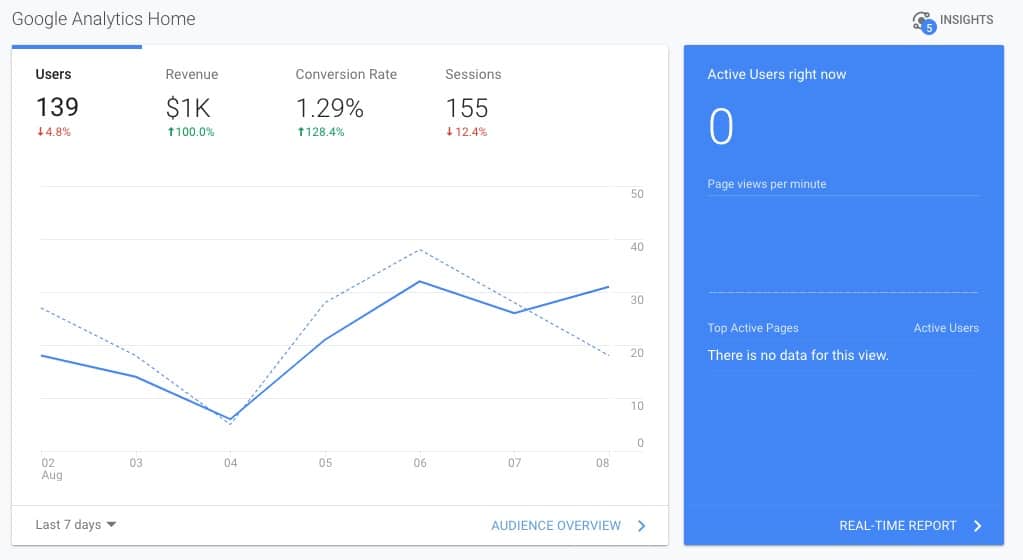
Once you have logged in, you will be presented with Google Analytics Home. By default, Google Analytics is set to the last seven days. You should see a line graph with your traffic for the past week. It should look something like this:

If you see traffic, great! Skip to “Finding Demographic Information” in Google Analytics.
If not, one of two things is happening. Your site is not getting any traffic (possible, but unlikely), or you have an account, but a different account is actually capturing the data for your site.
Adding Yourself to Another Google Analytics Account
The company that designed your website may have installed its own analytics account on your site. Before you panic, make sure you don’t already have access to your analytics but are looking at the wrong account.
At the top of the page, you should see a pull-down that looks something like this:

Click on the pulldown, and if you have multiple accounts under your Google login, they will all appear here. Click on a different account, and if you see traffic on the Home page, you are good. If not, try another account if there is one. If not, you will need to be added to the account that is tracking your audience.
If you are still in contact with the person who set up your site, ask them to add you as a user to Property in Google Analytics. Make sure of two things, first, that they use the email for your Google Account. It doesn’t matter if it is your personal account, you want to have access, and you have to have a Google Account (not necessarily a Gmail account). If you don’t have a Google Account, you can create one here.
Second and most importantly, make sure to add you as a user under Property, because if they add you to View, you won’t be able to turn the demographics tracking on within the account. Also, make sure that they give you the ability to Edit, Collaborate, Read & Analyze. You will need that level of permissions to get everything set up. You should receive an email that you were added. Now you can log back in, and you should see the new account. To ensure that demographics are being tracked, I explain how to determine that under “Make Sure That Google Analytics is Tracking Demographics.” If you are not in contact with the person who designed your site, you may have to start over and re-install Google Analytics.
Installing Google Analytics
If you don’t have Google Analytics installed or wish to start over, there are a few ways to install Google Analytics on your site. Some are easy, and some are a bit more tricky. We’ll start with the easy ones first.
In many cases, the platform you are using will have the ability to add Google Analytics to your website with a simple cut and paste method. So what are you cutting and pasting? Google Analytics has that all ready for you.
First, you will need to log into Google Analytics. The quickest way is to go to https://analytics.google.com and log in. Once you log in, on the left-hand side at the bottom, you will see the Admin. Click on Admin, click on Tracking Info, and then click on Tracking Code in the center column. Once you do that, you should see a page that looks like this:
![]()
Two items of significance are on this page that you will need to set up your Google Analytics on your site. The first is the Tracking ID at the top, and just below that is the actual code that runs Google Analytics on your site. Now let’s go back to your website.
Usually, Google Analytics information is under Settings in Wix, Squarespace, etc. You may have to dig or search for installing the tracking code on your site in the help section. Typically, installing tracking requires either the Tracking ID or the code in the box under Global Site Tag. Once you find it, copy and paste the needed information. Usually, you hit save, and you are done.
If you want to test it, there is a button on the Tracking Code page in Google Analytics to send test traffic to your website. Click the button, and it will open your site in a new tab. Go back to the Google Analytics tab, and you should see something to the effect, 1 active user right now (including 1 from test traffic). If you see that, you’re all set!
If you are using WordPress, installing Google Analytics can be a bit more tricky. Many of the themes you use with WordPress have a spot to paste the Google Analytics tracking code. They usually place it under Theme options, and the labeling varies from theme to theme. Fortunately, with WordPress, many plugins streamline the process if you are unsure. There is a great article by Elyssa Respaut that gives you five choices. My personal favorite is by MonsterInsights. Once you install the plugin of your choice, follow the instructions, and you should be good. I recommend that you test the traffic to make sure everything is working properly.
Regardless of what site platform you use, there should be an option to install Google Analytics. Even if the site platform uses its own version of Analytics, Shopify comes to mind. It wouldn’t hurt to install it in most cases. That requires going into the code. That is a little bit beyond the scope of this article. However, if you have read this far and want to add the tracking code to the HTML of your website, reach out to me and let me know that you read this article, and I will help you out.
Still with me?
Before you close out the Google Analytics tab, we need to make sure that your Google Analytics is set up properly to gather demographic information. You don’t have to go that far to check.
Make Sure That Google Analytics is Tracking Demographics
Under the Property column, the first option, Property Settings, is where you need to click next. Once you do, a page like this should appear:

If you are being asked to join the beta program, there will be a big blue bar at the top. Click Accept and the page will take you to a couple of opt-in questions, and your site will be set up. If not, scroll down, and the first thing to check is to make sure that your Industry Category is set correctly. Select the option that is closest to what your category is. Now, there is a good chance that there isn’t an exact match, and I don’t know why there aren’t more options under this tab, but this is Google, and they do what they want. Once you select the category, continue to scroll down to Advertising Features.
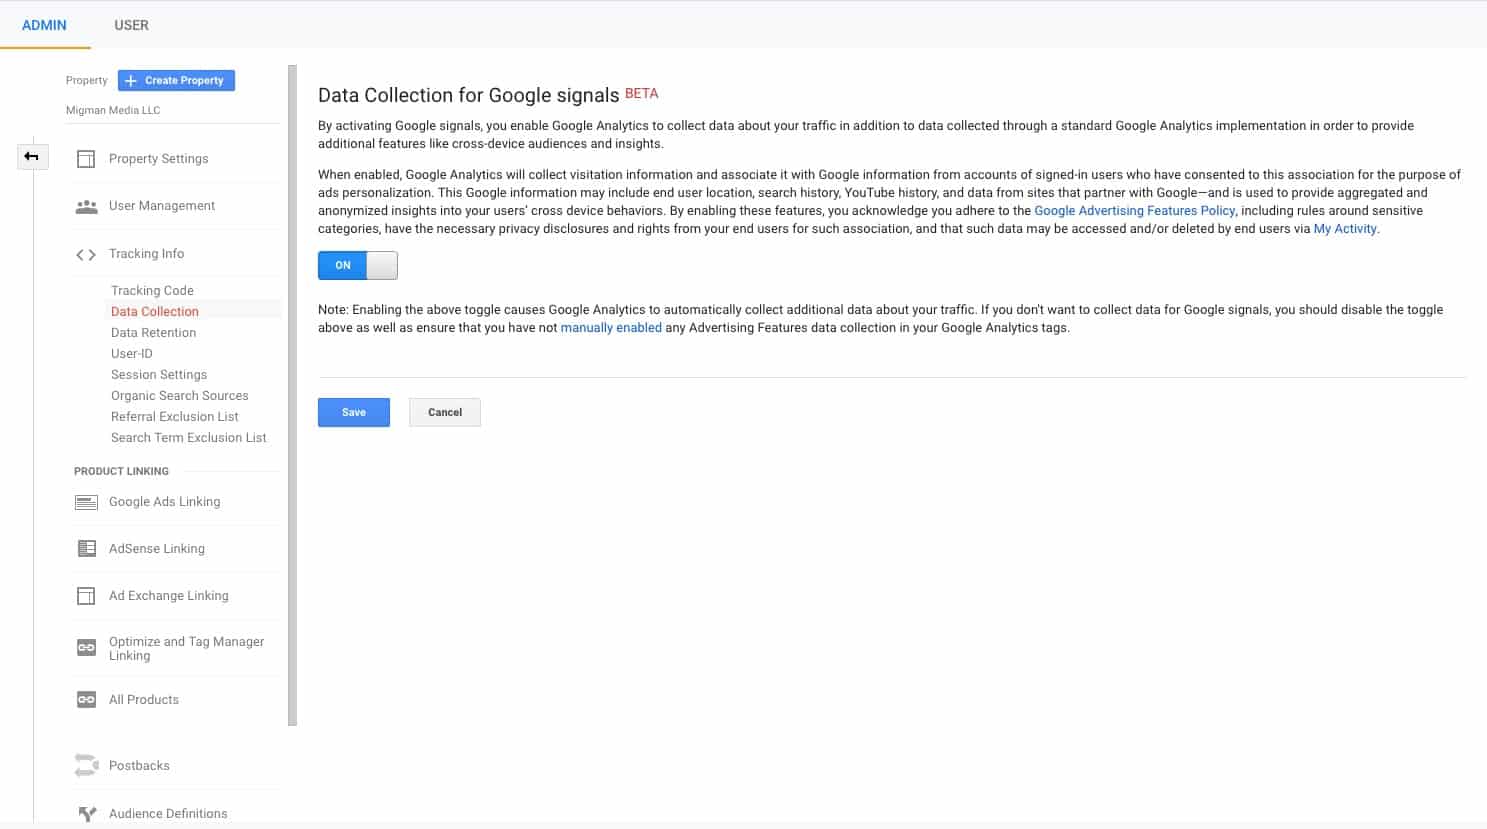
Advertising Features needs to be on. If the button says OFF, click it and it will turn blue and say ON. Continue to scroll down to Enable User Metrics in Reporting. This one also needs to be turned to ON. Once that is set, hit Save, and you’re all set. See, that wasn’t that hard. We did skip over a few different items, but for tracking demographics, they aren’t needed.
Finding Demographic Information in Google Analytics
If your tracking is set up properly, you should see that Google Analytics compiles your site visitors’ demographics. This information can give you a significant idea of your visitors and what are some of their interests. Let’s dive a little deeper into the reports.
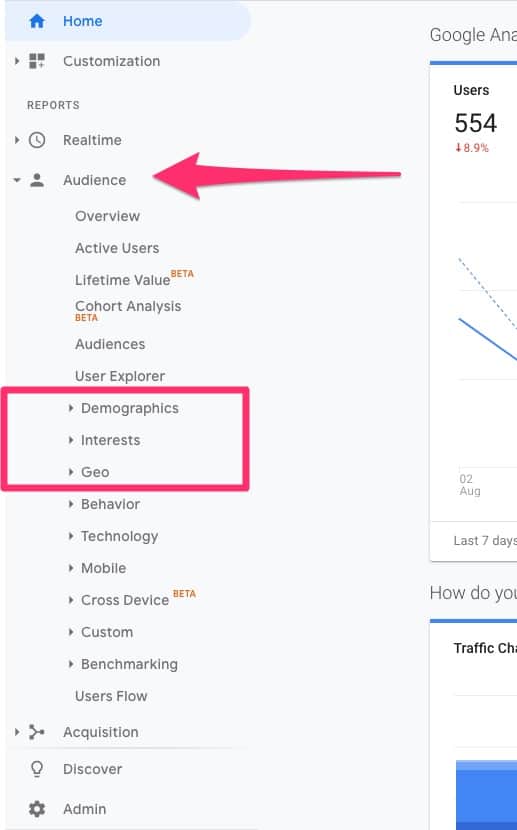
To find the Demographics in Google Analytics, on the left-hand side navigation, click on Audience. Here you will see a whole host of reports that you can dive into.

The three to focus on are Demographics, Interests, and Geo, but feel free to explore the other tabs as they hold additional information that could be useful depending on your marketing strategy.
Demographics
When you click on the Demographics tab, you will see Overview, Age, and Gender. This is pretty standard demographic information. The Overview will give you two charts, the male, female ratio and the breakdown by age. If you know your customer, this information shouldn’t come as a surprise. The next two tabs have significantly more information on those categories.
A quick note on gender, Google Analytics separates gender by what it knows about you, the visitor. It goes by how you wish to identify yourself, not your biology. Why is this important? If you are marketing something for female or male biological parts, some of your gender audience may identify as one gender or another so that the numbers might be skewed. Something to keep in mind.
Both Age and Gender have the same information categories. You can see bounce rates, the average number of pages, and the site’s average time within these sections. If you have Conversion Goals set up, you can also see how each group converts (more on how to set them up later).
The information in the first column is also clickable. If you are in the Gender tab and click on Female, you will then be brought to a table that breaks down the age groups for females. You click again, and it will show you additional categories that they fall into, for example, Arts & Entertainment. You can also drill down under the Age category if you click on an age group. This will give you the make, female breakdown for that age group, and click again for the additional categories. Pretty cool, right? Next, we’ll talk a little bit about what’s under the Geo tab. We’ll come back to Interests as that is a bit more complicated.
Geo
The Geo tab is pretty self-explanatory. Your two options are Language and Location, and they both do what you expect them to do. Language shows you your traffic broken down by language. When you click through, it doesn’t have any additional demographic breakdown. The other tab, Location, has a bit more to offer.
When you click on the Location tab, you will see your traffic broken down by country then, as you would expect, by state or providence. For the US, you can see the city’s breakdown if you click through the state listing. Like the other demographic tabs, you can see how each level is converting as you drill down in each section.
Interests
Interests are probably the most in-depth demographic report in Google Analytics and arguably the most useful for digital marketing. This tab gives you details about your audience beyond location, age, and gender. Interests are broken into three categories, Affinity Categories, In-Market Segments, Other Categories. On the surface, those titles will make your eyes roll back into your head. However, once you learn how the data is broken down, the titles are less ambiguous.
Affinity Categories are basically top-level interests of your audience, for example, Shoppers or Music Lovers, or Foodies. They are very general. Why are they considered very general? When you say Shopper, what are they shopping for? Clothes? Cars? Furniture? If you are looking for more specific information, you will have to look to one of the other categories under Interests. Again, you can click through to an age breakdown and then by gender. You can also view the conversions based on a specific category or a particular age or gender within that Affinity Category.
In-Market Segments breaks down your audience by product purchase interests. Going back to shoppers, what are they shopping for, Apparel, Travel, Shoes? These are the categories in which your audience has made some interaction. This is valuable when you want to target specific lookalike audiences.
Other Categories is a further breakdown of the Affinity Categories. You can see that Media & Entertainment visitors are interested in Celebrity News and TV Reality Shows, and even Hip-Hop music. Of course, past performance doesn’t necessarily predict future performance. Still, unless you are looking to shift your target audience completely, there is a good chance that this will stay pretty consistent.
Pulling it All Together
If you are pretty on top of things, these tabs’ data shouldn’t be too surprising. If you sell women’s clothing, finding a majority of your audience is women shouldn’t be too far of a stretch. However, diving into their other interests will give you more information about who to target future campaigns. If you have a targeted campaign running, you can check to see if the correct audience is making it to the site.
One word of caution, this data is very quantitative. It can give you an idea of your audience, but it won’t give you who your audience is. That requires a more one on one approach and acquiring qualitative data about your customer. Companies do it all the time by sending out periodic “How am I doing?” surveys. It’s a mixture of both quantitative and qualitative that will give you a more holistic view of who your customer and, thereby, your audience is. More on that in a later post.
Whether quantitative or qualitative, the great thing about data is that it can be used in many different ways. It can confirm or contradict what you think should be happening. You can use it to dig deeper into your audience to find new opportunities for your marketing and confirm that those opportunities are moving in the right direction. To ignore it would be the equivalent of flying blind.


